An outlier of a statistical sample is an extreme value – the very rich man, the dwarf, the Spruce Goose – a large plane built by reclusive billionaire Howard Hughes. It flew only once and now sits in a museum – a monument to people with too much money.
There are many methods of classifying outliers, but all of them do it in terms of how far a suspected outlier is from the typical value, for example:
More than the difference between a value and the mean
The difference between a value and the median
More than 1 standard deviation difference with the mean.
Some of these may result in two many outliers, failing to separate the extreme values from the uncommon values that are still within the normal range. We may change the number of outliers by introducing a constant k, so the above measures become:
More than k times the difference between a value and the mean
More than k times the difference between a value and the median
More than k times the standard deviation difference with the mean.
In fact the definition of outlier is often taken to be this: If a value is greater than the upper quartile plus 1.5 times the interquartile range, or less than the lower quartile -1.5 times the interquartile range, it is an outlier.
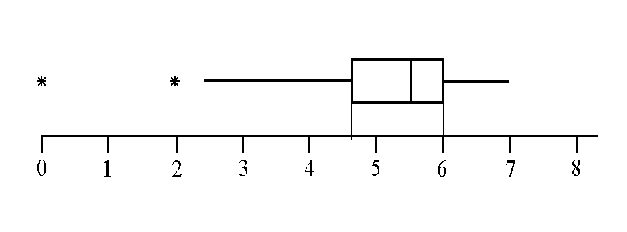
This is illustrated on the boxplot below.

The lower quartile is about 4.6 and the upper quartile is 6.
Anything below 4.6-1.5(6-4.6)=2.5 is an outlier. There are two.
Anything above 6+1.5(6-4.6)=8.1 is an outlier. There are none.