Damped Spring Oscillations
Apparatus:
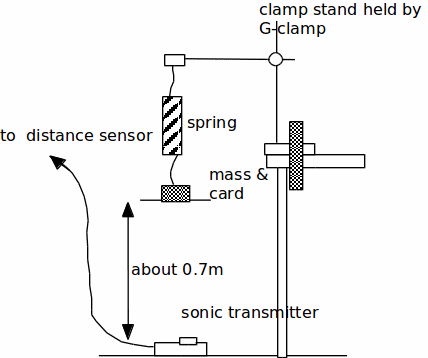
PC, DL128 data logger with a DISTANCE sensor with sonic transmitter, G-clamp, clamp stand with clamp & boss, spring with 500g mass attached to a piece of card, metre ruler.
Introduction:
In this experiment you are going to use a data-logger to show how the amplitude of the oscillation of a mass on the end of a spring varies with time. You are also going to note how the speed and acceleration of the oscillating mass varies with displacement. These variations will be shown graphically on the computer monitor. Please follow the instructions below carefully remembering that computers and their software are stupid!
Procedure:
1. The PC has already been switched on and the data logger and sensor have already been wired up to it. DO NOT SWITCH OFF THE PC OR ALTER THE WIRING. Switch on the distance sensor (Press 'ON' button). It should cause the sonic transmitter to emit a clicking noise. A click is produced twenty times per second.
2. Place the sonic transmitter on the floor facing upwards (see diagram). Position the card under the mass on the end of the spring so that the card is about 0.7m above the sonic transmitter. The distance sensor should show the actual distance. Ensure that the spring is well clamped at its top and that the clamp stand is firmly held onto the bench with the G-clamp.
Setting up the program:
S1. On the PC double click on the DATADISC PRO icon and wait for the program to load. After a few seconds a screen containing menus should appear.
S2. From the MEASURE menu select "RECORD". The Recording Choice Demon screen should appear.
S3. Click on NEXT SIX times until a recording interval option screen appears showing '200ms'. Change this to 100ms then click NEXT and FINISH.
S4. A window containing graph axes should now appear. Maximise this window.
Collecting Data:
C1. READ ALL OF THIS PARAGRAPH BEFORE DOING ANYTHING!
To collect data you initiate the computer by pressing the green RECORD icon (next to what looks like a tape recorder below the menu bar). When you have done this the distance sensor will measure the distance vertically between the sonic transmitter and the card attached to the mass (initially about 0.70m). It will measure this distance every 0.1 second (100ms) over a total time of two minutes. The computer screen will show a graph of this distance against time.
C2. Displace the mass downwards by about 15cm and let go.Click RECORD and wait for two minutes. AVOID approaching the mass during this time. You should see a small, blue sinusoidal trace appearing on the computer screen.
C3. After two minutes the graph scales will be readjusted and you should see the typical pattern of a damped oscillation. (If something has gone wrong then restart from stage S2)
C4 Print out this trace.
C5 The decay of the spring's oscillations should be exponential. Use your trace to measure the amplitude of oscillation at about eight time points during the two minutes. Tabulate your measurements.
C6 On the menu bar select DATA and the option 'Calculate'. Click the 'da/dt' box and then the calculate button. This will calculate the speed variation of the mass and display it on your graph as a red curve.
C7 Again on the menu bar select DATA and the option 'Calculate'. Again click the 'da/dt' box BUT NOW FROM THE BOTTOM DROP DOWN MENU select 'a = speed' and then click the calculate button. This will calculate the acceleration variation of the mass and display it on your graph as a green curve. By this stage your screen will look a total mess.
C8 On the menu bar select GRAPH and the option 'Scale time'. Follow the instructions in red at the bottom of your screen to display about a five second period only on the time axis.
C9 Look at the three traces and answer the questions below:
Questions & analysis:
1. If the displacement (blue line) variation is sinusoidal how would you describe the speed (red) and acceleration (green) variations?
2. Estimate the period of the oscillation and use the equation![]() to estimate the spring constant (
to estimate the spring constant (![]() ) of the spring.
) of the spring.
3. Use your results table (from C5) to draw a graph of![]() against time.
against time.
4. If the decay of the amplitude is exponential then the amplitude![]() decays from an initial value
decays from an initial value![]() over a period of time
over a period of time![]() according to the relationship
according to the relationship![]()
(i) Use your graph to find the value of the constant![]()
(ii) What is the physical significance of the![]() - intercept of your graph?
- intercept of your graph?