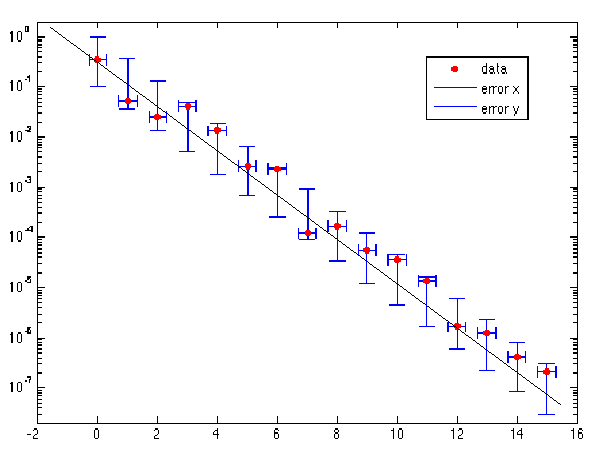
Error bars are used on graphs to indicate the error, or uncertainty in a reported measurement. They give a general idea of how accurate a measurement is, or conversely, how far from the reported value the true (error free) value might be. Error bars may go from the maximum to minimum possible value or indicate the standard deviation or standard error.
Error bars can be used to visually compare two quantities, assuming various other conditions hold, to determine whether differences are statistically significant. They can also show how good a statistical fit the data has to a given function.
Typically we want to plot points that fit a straight line, and might have to transform the data in some way, for example, by taking logs, which could mean labelling an axis as powers of 10, as below.

The data here all lies within the bars allowed by experimental error, so for the the graph shown, we can say that within the limits of uncertainty, for this range of data![]() has a linear relationship with
has a linear relationship with![]() The above arrow bars are centred on the line. We could instead centre the arrow bars on the data and will come to the same conclusion.
The above arrow bars are centred on the line. We could instead centre the arrow bars on the data and will come to the same conclusion.