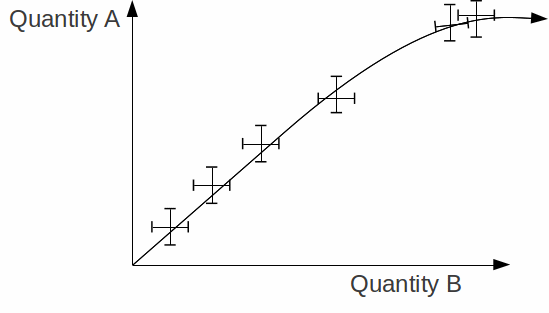
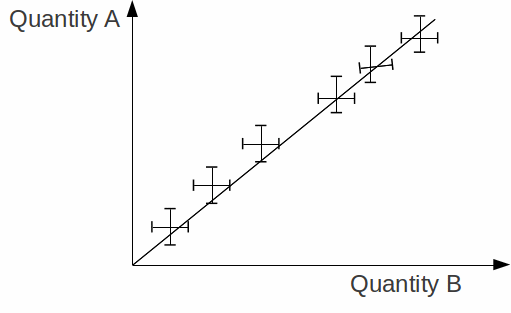
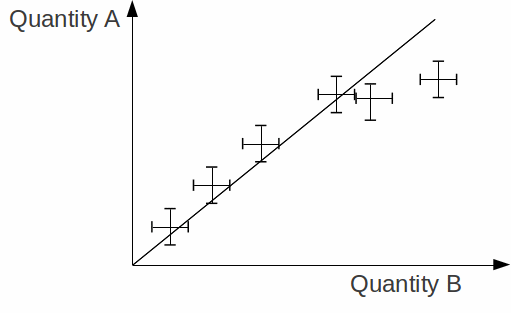
In many situations the best method to present an assess data is to use a graph. Error bars enable goodness of fit to a specific statistical model to be assessed. Since the error represents the uncertainty range, the best fit curve should pass through all the rectangles created by the error bars as the the first two graphs below but not the last graph.


The last model is not a good fit to the data.