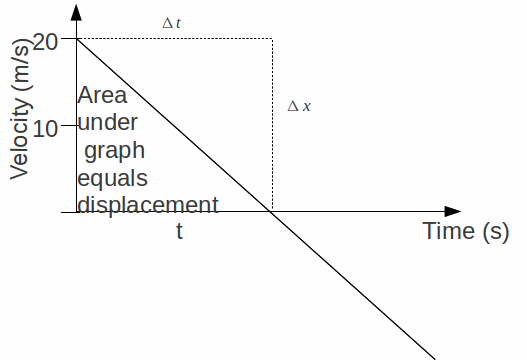
Velocity times graphs indicate the velocity as a function of time. One direction is taken as positive and one direction is taken as negative, so only this forwards and backwards motion can be displayed. At any time t the velocity can be read of the vertical axis by moving up from a certain time t to meet the graph then along to read off the velocity. The graph below illustrates the variation with time of a ball thrown vertically up in the air with a speed of 20 m/s. The acceleration is a constant 10 m/s (approximately) downwards, so the gradient is -10 m/s/s.

General Points
-
The gradient at any point is equal to the acceleration. In particular a horizontal line has zero gradient and the acceleration is zero there, and if a section of the graph has a constant gradient then the acceleration over that section is constant.
-
At any time when the graph intercepts the t axis, the velocity is zero .
-
The area under a velocity time graph is the displacement from the reference point.
-
If the graph is a curve, then the instantaneous velocity at a point can be estimated by drawing a tangent vector at the point and finding the gradient of the tangent.
-
We can construct a velocity time graph given a displacement time graph by finding the gradient at each point and plotting the gradient, which will be equal to the velocity, against time.