Mean and Standard Deviation of Lists of Numbers
To find the mean of a list of numbers, we add the numbers up and divide by how many numbers there are. The standard deviation is a measure of spread – the more spread out the numbers are, the higher the standard deviation will be.

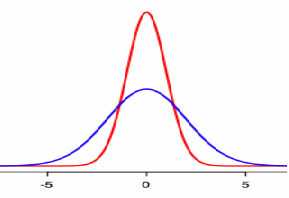
The graphs above show two normal distributions corresponding to two different standard deviations. The standard deviation of the blue normal curve is higher than that of the red normal curve.
There are three formulae for the standard deviation that can be applied to lists of numbers:

This is an unbiased estimate for the mean – we expect to get the true standard deviation.

This is a biased estimate. We will not expect to get a true or best estimate of the standard deviation.

This is also an unbiased estimate.
The formula for the mean of a sample,![]() is an unbiased estimate for the mean.
is an unbiased estimate for the mean.
There is another measure of spread – the variance. It is the square of the standard deviation.