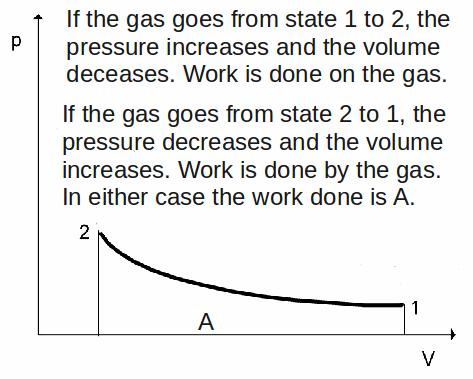
It is often useful to represent the changes that happen to a gas during a thermodynamic process on a![]() diagram. This is a graph of pressure,
diagram. This is a graph of pressure,![]() against volume,
against volume,![]() The volume is usually put on the
The volume is usually put on the![]() - axis and the pressure on the
- axis and the pressure on the![]() - axis. These graphs are useful because the area under the graph represents the work done on the gas or by the gas.
- axis. These graphs are useful because the area under the graph represents the work done on the gas or by the gas.


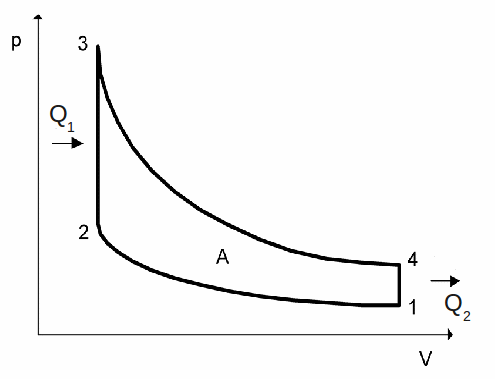
The gas does a net amount of work A on its' surroundings, equal to the area under the graph between states 3 and 4 minus the area under the graph between states 1 and 2. This area is the difference between![]() and
and![]()
