There are three very important things to remember about velocity time graphs.
-
The distance travelled is the area under the graph.
-
The gradient is equal to the acceleration. If the graph issloping up – the gradient is positive – there is acceleration.If the gradient is negative – the graph is sloping down – thereis deceleration - the acceleration is negative.
-
The average speed is equal to the total distance (the areaunder the graph) divided by the total time.
-
If the speed is constant the graph is horizontal (thegradient is zero).
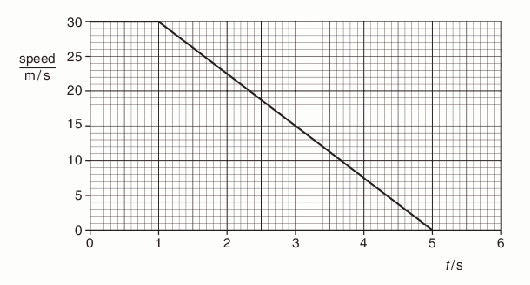
The above graph shows the motion of a car. The car travels with constant velocity
 for the first second.
The area under the graph is a trapezium. The distance travelled is equal to the area.

Between 1 and 5 seconds it decelerates :
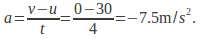
There is deceleration of