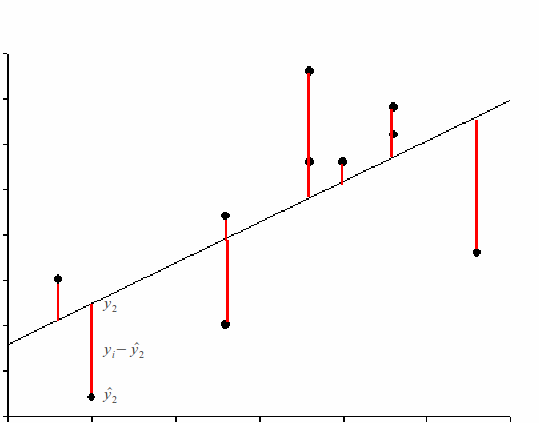
Suppose we have a set of data points![]() relating one quantity to another. We can plot the points on a scattergraph and find the equation of the regression line of
relating one quantity to another. We can plot the points on a scattergraph and find the equation of the regression line of![]() on
on![]() so that
so that![]() is expressed linearly in terms of
is expressed linearly in terms of![]() If we take one of the points from which the equation of the regression line was calculated,
If we take one of the points from which the equation of the regression line was calculated,![]() he regression line predicts, for a value
he regression line predicts, for a value![]() a value
a value![]() The residual is then
The residual is then![]()

|
|
|
Residual |
|
65.0 57.8 77.8 89.0 93.4 73.1 83.1 86.8 70.0 83.0 |
74.4 97.7 74.4 83.3 78.2 87.7 81.0 83.3 65.6 78.9 |
-9.4 -39.9 3.4 5.7 15.2 14.6 2.1 3.5 4.4 4.1 |
The residuals add to zero, since![]()
This might make it seem that they do not have much use, but in fact the sum of the squares of the residuals is an important statistical measure, enabling us to derive the equation of the regression line and to derive the normal distribution.
