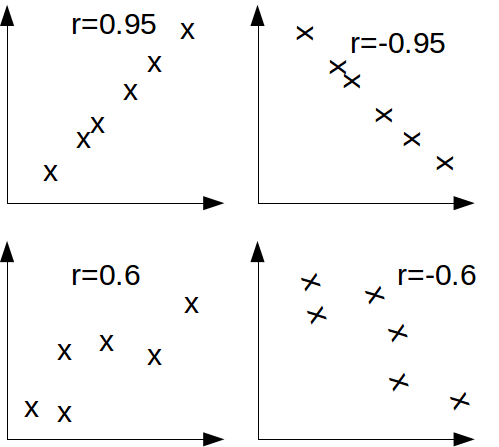
Regression coefficients tell us how good a fit our data is to a straight line. The regression coefficient is a number between -1 and 1. -1 means a perfect relationship. All the points are on a straight line, and the graph slopes down. 1 means a perfect relationship. All the points are on a straight line and the graph slopes up. Some values, along with the data they summarise, are given below.

The first has a positive linear correlation. It is not exact. It is maybe 0.95.
The second has a negative correlation. It is also not exact. It is maybe -0.95
The third has a positive but weaker correlation. We can still find a correlation coefficient, but it will not be as much use.
The fourth has negative correlation of about 0.65.
We want to find the correlation coefficient for the data in this table.
|
x |
2 |
4 |
7 |
3 |
5 |
1 |
|
y |
10 |
5 |
2 |
9 |
4 |
10 |
To find the correlation coefficient it is most efficient to first find the summary statistics. Your calculator may have functions to help. They are
![]()
![]()
![]()
The correlation coefficient is then calculated from
r=
This means the data is a very close fit to a straight line.
The variation of![]() accounts for
accounts for![]() % of the variation in
% of the variation in![]()
