|
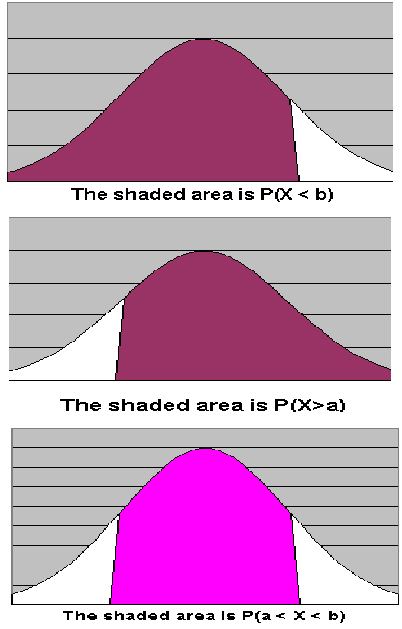
| Suppose we have a distribution using the diagram on the left.
This corresponds to a probability of 0.6915 hence |
| Now we will find
normal distribution tables and look for the probability corresponding to
Because the probabilities in the tables are all of the form We subtract this value from 1 again to obtain | |
| Now we use
|
Call Us 07766496223

