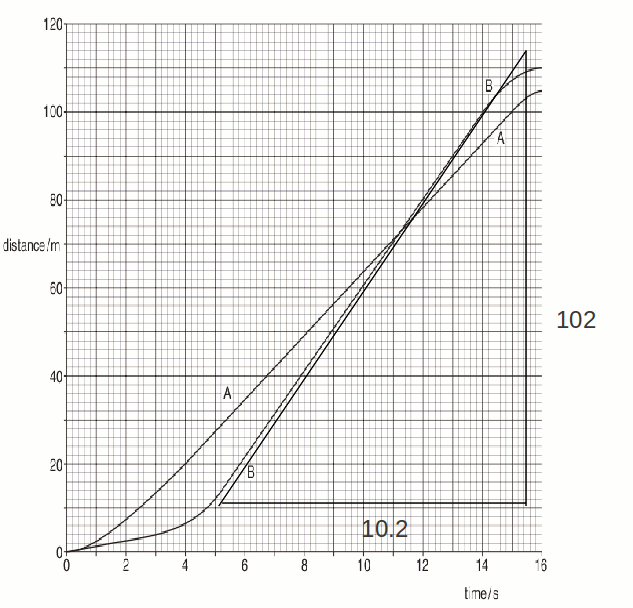
Distance time graphs display time on the x axis against distance, or more accurately, displacement, on the y axis. At any point on the graph, the gradient is equal to the velocity. Distances or velocities can be compared by plotting motion on the same graph. For the two motions shown above, A starts off quicker because it has the larger gradient, then after about 5 seconds B starts to travel faster, passing A just after 11 seconds, after having travelled about 72m. B has a greater displacement and velocity for the remainder of the motion.

At the point where B crosses A, the velocity of B is![]()
