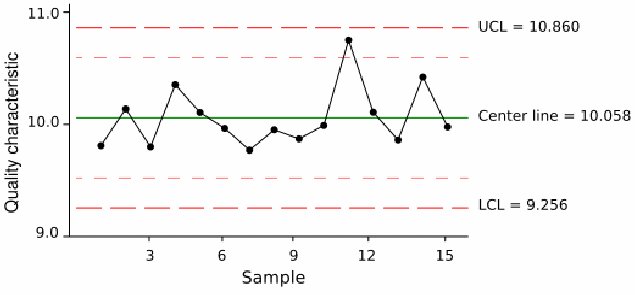
Control charts are much used in quality control to track statistics such and the mean and standard deviation in a production process.
-
They consist of points representing a statistic being tracked plotted against time.
-
The mean
 of this statistic – the mean, the mean variance typically - using all the samples is calculated.
 -
A centre line is drawn at the value of the mean of the statistic
-
The standard error
 of the statistic in question using all the data is found.
 -
Upper and lower control limits,
 and and
 that indicate the threshold at which the process output is considered statistically 'unlikely' are drawn typically at 3 standard errors from the mean line(
 above).
The chart may have other optional features, including:
-
Upper and lower warning lines typically two standard errors above and below the centre line.
-
Division into zones, with the addition of rules governing frequencies of observations in each zone.
-
Annotation with events of interest, as determined by the Quality Engineer in charge of the process's quality.
A control chart is shown below.

