Apparatus:
50 dice, dice thrower
Procedure:
1. Count 50 dice into the dice thrower and then cast the dice CAREFULLY onto the bench top.
This is throw number![]() with dice number
with dice number![]()
2. Count and remove any dice showing a ‘6’. Replace the remaining dice back in the thrower.
3. Repeat the above until there are less than six dice left.
4. Repeat all of the above twice more.
5. For each of your throw t calculate the average number of dice before the throw (Nav)
6. Tabulate your results under the headings:
Throw number![]() average number of dice before throw,
average number of dice before throw,![]() and
and![]()

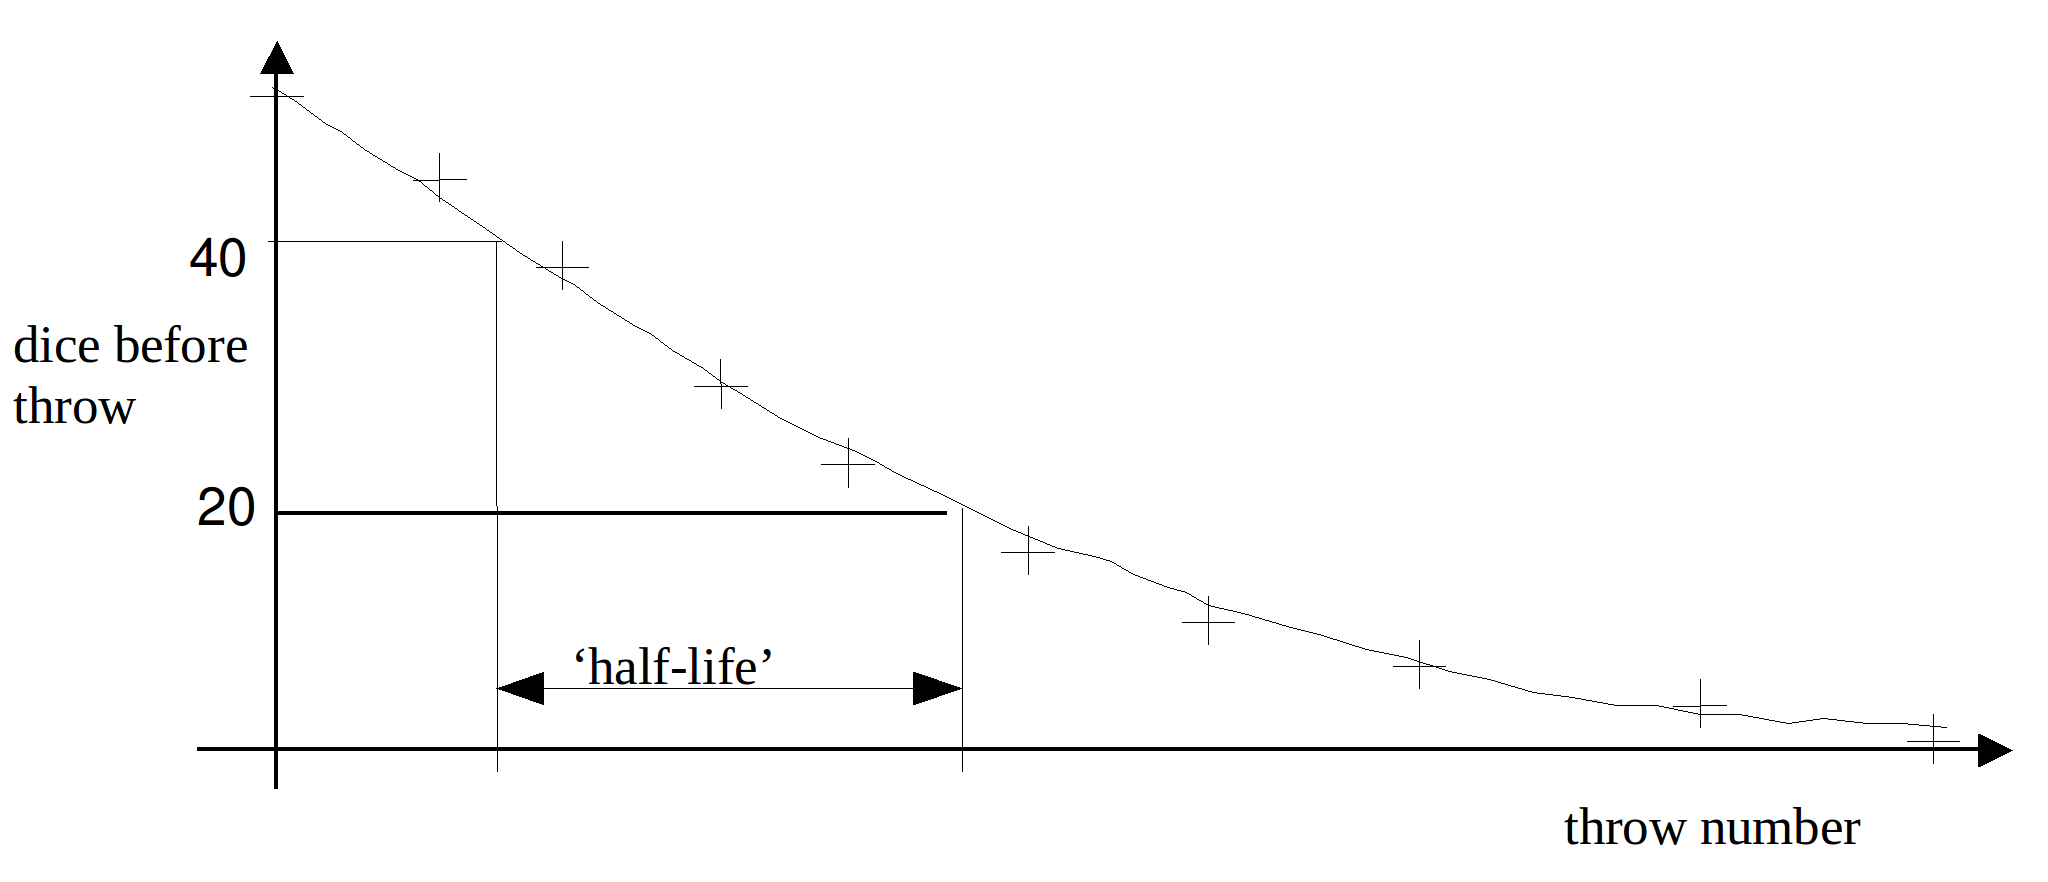
7. The decrease in the number of dice left after each throw is analogous to the decay of unstable nuclei. Each throw number represents the passage of a certain amount of time, for example 1 second. A graph of ‘average dice after throw’ against ‘number of throw’ would look the same as a graph of ‘number of nuclei left’ against ‘time’ such as you should have come across at GCSE. From this graph you should know how to calculate a half-life value.
8. Plot a graph of ‘average dice before throw![]() ’ against ‘number of throw,
’ against ‘number of throw,![]() ’ and calculate the ‘half-life’ of the dice in terms of throws.
’ and calculate the ‘half-life’ of the dice in terms of throws.
9. Plot a graph of![]() against number of throw,
against number of throw,![]()
This graph should be a straight line of negative gradient.
10. Measure the gradient of your second graph, it is equal to the NEGATIVE of the decay constant, of the dice.
11. Explain why you would expect the decay constant to equal 1/6th.
12. See if your half-life value is equal to![]() as would be expected from theory.
as would be expected from theory.
13. Why would this experiment would give better results if more dice were used?
14. What would you expect your values of ‘half-life’ and ‘decay constant’ to be if:
(a) dice with ‘5’ as well as ‘6’ were removed.
(b) dice with ‘4’, ‘5’ & ‘6’ were removed.
