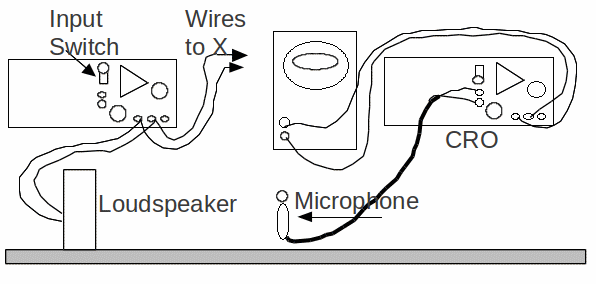
Apparatus: Two Unilab Audio-frequency generators (AFOs), cathode ray oscilloscope, long wires, microphone, metre rule, loudspeaker, thermometer, set square.
Diagram:

Procedure:
1. Connect the loudspeaker to the loudspeaker (LS or low ) terminals of the AFO (see diagram). Check that the ‘input switch’ is in the up position. Switch on the AFO, and set it at about 2 kHz. Place the microphone in front of the loudspeaker. Connect the microphone to the other AFO as shown in the diagram. With its ‘input switch’ in the down position it will amplify the signal from the microphone. Connect the output of this amplifier to the Y-plate input of the CRO.
Connect the loudspeaker AFO output to the X-plates of the CRO (The input to these plates is found at the back of the oscilloscope.
Note: In the diagram above the Earth/0 volt lines are shown as the bolder wires:
2. Turn the time-base control of the CRO off. Adjust the settings of both AFOs & CRO until a clear trace (probably elliptical) is obtained on the CRO’s screen. Try not to use a high volume!Move the microphone along a line away from the loudspeaker.
The trace on the CRO’s screen should turn into a straight line, then another ellipse, then another
straight line (but of opposite slope to the first), then an ellipse, then a straight line (of same slope as the first), then an ellipse, etc....
3. Measure the distance moved by the microphone between adjacent straight lines.
A straight line occurs when the microphone position is such that the wave sent direct to the CRO’s![]() - plates is either in phase or completely out of phase with the wave picked up by the microphone and sent to the CRO’s
- plates is either in phase or completely out of phase with the wave picked up by the microphone and sent to the CRO’s![]() - plates.
- plates.
Adjacent straight lines (of opposite slope) will occur when the microphone is moved through half a wavelength.
Measure the distance moved by the microphone as it passes through a number of straight lines. Note also the frequency of the loudspeaker AFO by connecting a frequency meter across its output terminals.
4. Repeat stage 3 for five other frequencies.
5. Measure the temperature.
6. Tabulate your results under headings:
frequency (![]() ), 1/frequency (
), 1/frequency (![]() ), distance between 1st and nth straight line (
), distance between 1st and nth straight line (![]() ), inter-line distance (
), inter-line distance (![]() ), wavelength (
), wavelength (![]() ).
).
NOTE: wavelength = 2 x inter-line distance.
7. Plot a graph of wavelength against 1/frequency. The gradient of this graph is the speed in m/s.
8. Compare your calculated speed with that expected from the formula speed (m/s) = 331 x ²(temperature in kelvin / 273)
