

Variable: A part of the experiment that you could change, e.g. the size of the beaker or the amount of substance.
Dependent Variable: The variable you will measure, e.g. change in temperature or the time something takes. This variable is plotted on the vertical axis of a graph.
Independent variable: The variable you deliberately changed, e.g. concentration of acid or size of current. This variable is plotted on the horizontal axis of the graph.
Fair test: Changing only 1 variable and keeping all the other variables the same. This means you are only testing the effects of one variable, e.g. keep the volume of water the same.
Precision: How accurate the measuring device is, e.g. do the weighing scales go to 2 decimal places? 12.6g is less precise than 12.57g or 82ºC is less accurate than 82.39ºC. Precision can be improved by using better equipment, or a better range or scale.
Accuracy: How correctly the operator reads the equipment. Saying it’s about a minute is not as accurate as saying 62 seconds. You can improve accuracy by checking your reading with someone else. Take care writing down your results in your table, e.g. writing 3.62 instead of 3.26.
Reliability: This is how sure you are that your data are correct. You can improve reliability by repeating the experiment and taking an average of the results.
Anomalous results: These are results that do not fit the pattern of all the other results.
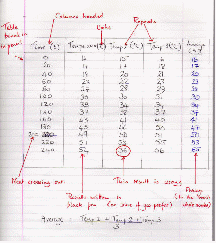
Record measurements methodically and accurately in a table as shown below.
 =
=
Notice that:
-
The table is boxed in with lines drawn with a ruler, please;
-
The quantities are placed as column headers;
-
The units are put in with the quantities in the header.
-
The columns are headed with the quantities (time, temperature);
-
The table has been boxed in;
-
Repeat readings have been taken, and the average (to the nearest whole number) has been worked out;
-
There is NO problem if you make a mistake. Cross it out neatly.
-
There is a wrong result. Ignore it and take the average of the two readings.
We take repeats to reduce the uncertainty. On its own, the set of data with the wrong result might lead us to the wrong conclusion. If we have other data to compare it with, we can be confident that that data point was wrong so we can ignore it.