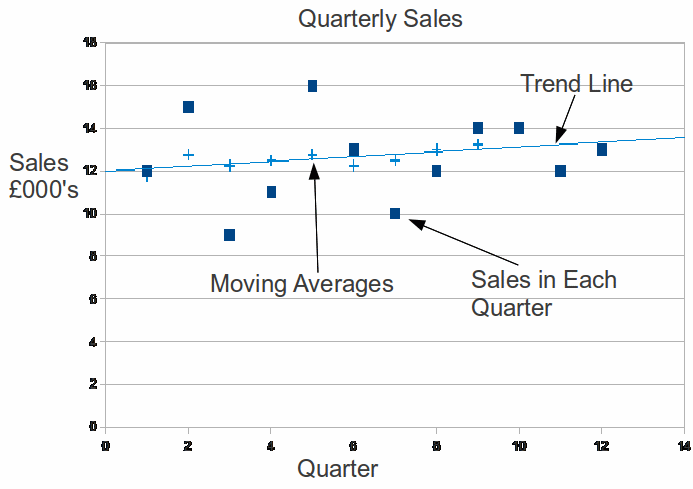
Moving averages allow us to identify a trend when we have quantities that flucutate over time. For example, ice cream sales may fluctuate by season, with higher sales in the summer and lower sales in the winter. By finding the moving average it becomes much easier to find out if ice cream sales are increasing from year to year.
The table below shows quarterly ice cream sales over three years.
|
Quarter |
1 |
2 |
3 |
4 |
5 |
6 |
7 |
8 |
9 |
10 |
11 |
12 |
|
Sales £000's |
12 |
15 |
9 |
11 |
16 |
13 |
10 |
12 |
14 |
14 |
12 |
12 |
We find the 4 point moving average by finding the average of the sales of quarters taken four at a time, moving from left to right one point at a time.
|
Quarter |
1 |
2 |
3 |
4 |
5 |
6 |
7 |
8 |
9 |
10 |
11 |
12 |
|
Sales £000's |
12 |
15 |
9 |
11 |
16 |
13 |
10 |
12 |
14 |
14 |
12 |
12 |
|
Moving Averages £000's |
11.75 |
|||||||||||
|
12.75 |
||||||||||||
|
12.25 |
||||||||||||
|
12.5 |
||||||||||||
|
12.75 |
||||||||||||
|
12.25 |
||||||||||||
|
12.5 |
||||||||||||
|
13 |
||||||||||||
|
13.25 |
||||||||||||
From these results we can plot the following graph. By plotting a trend line we can forecast annual sales for a year ahead.

