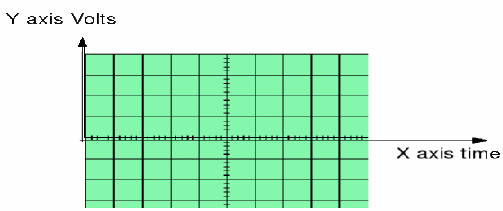
A cathode ray oscilloscopes is used to display electric voltages and waveforms. It does this using the x – axis as the time axis and the y – axis as the voltage axis: Not each square is 1 cm by 1 cm.

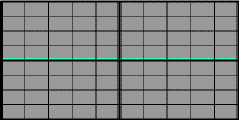
When it is switched on it displays just a horizontal line:
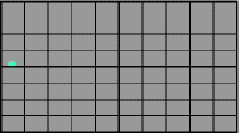
Because time is moving forward, we have to display the voltage by letting a pulse on the screen move along the x – axis. In the diagram below no input voltage is applied. If we now speed up the pulse we will have a continuous line on the screen, still reading no volts.

If we increase the sensitivity of the time base sufficiently we will have a continuous line.

Now we connect the input to a voltage source.

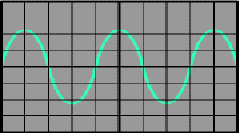
If the voltage is from an alternatiing source as above, it will display the actual waveform. The peak voltage is about 2.2 squares. The actual voltage will depend on the y scale measured in volta/cm. If the scale in the diagram above is 2V/cm the actual peak voltage will be![]() To find the practical or rms voltage we use
To find the practical or rms voltage we use![]() We may also have to find the period or frequency. This will depend on the scale of the x – axis. Suppose the scale is 20ms or milliseconds per division or ms/cm. Then 1 period is 4*0.02=0.08 seconds and the frequency is
We may also have to find the period or frequency. This will depend on the scale of the x – axis. Suppose the scale is 20ms or milliseconds per division or ms/cm. Then 1 period is 4*0.02=0.08 seconds and the frequency is![]()
