

Cumulative frequency curve enable you to read off the number of values that are less than a certain value, more than a certain value or between two values. We may also read off the lower and upper quartiles and the median, and find the inter – quartile range. We start wit a raw frequency table.
|
Marks |
Frequency |
|
0 – 10 |
2 |
|
10 – 20 |
8 |
|
20 – 30 |
12 |
|
30 – 40 |
18 |
|
40 – 50 |
28 |
|
50 – 60 |
22 |
|
60 – 70 |
6 |
|
70 – 80 |
4 |
Now we construct a cumulative frequency column by adding up the frequencies as we go down. In this way, for each interval, we obtain the number of scores that are less than the upper value.
|
Marks |
Frequency |
Cumulative Frequency |
|
0 – 10 |
2 |
2 |
|
10 – 20 |
8 |
10 |
|
20 – 30 |
12 |
22 |
|
30 – 40 |
18 |
40 |
|
40 – 50 |
28 |
68 |
|
50 – 60 |
22 |
90 |
|
60 – 70 |
6 |
96 |
|
70 – 80 |
4 |
100 |
Now we sketch a graph of score on the x – axis against cumulative frequency on the y – axis. We draw a smooth curve through all the points. We find the lower quartile by finding ¼ of the total frequency ie ¼ of 100 =25 going up the y axis to 25, along to the graph, down to the x -axis, and estimate the x – value there: 31
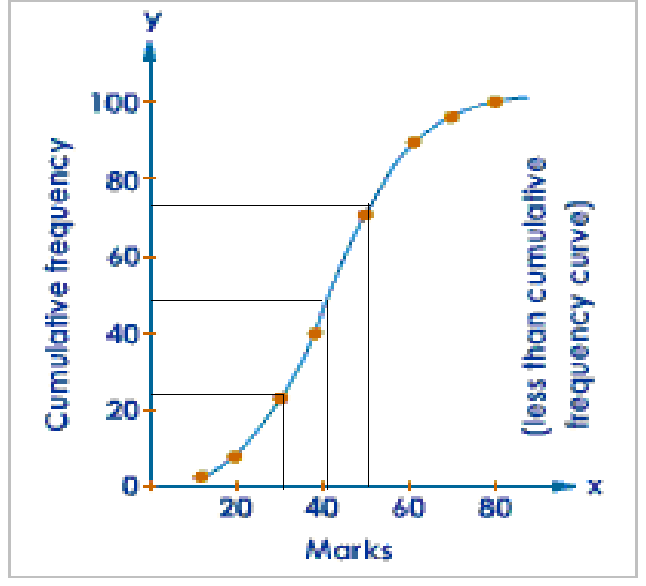
We find the upper quartile by finding 3/4 of the total frequency ie 3/4 of 100 =75, going up the y axis to 75, along to the graph, down to the x – axis and estimate the x – value there: 51
Then the interquartile range is 51-31=20
We find the median by finding 1/2 of the total frequency ie ½ of 100 =50, going up the y axis to 50, along to the graph, down to the x – axis and estimate the x – value there: 41