We need a method of visualising a function of two variables,![]() We can find the value of
We can find the value of![]() for any
for any![]() by substitution, but cannot plot
by substitution, but cannot plot![]() in two dimensions. We can however equate
in two dimensions. We can however equate![]() with
with![]() and construct a plot in three dimensions, or we can put
and construct a plot in three dimensions, or we can put![]() where
where![]() is a constant and plot the set of points
is a constant and plot the set of points![]() satisfying
satisfying![]() for various values of
for various values of![]() The set of points satisfying
The set of points satisfying![]() is called a level curve of
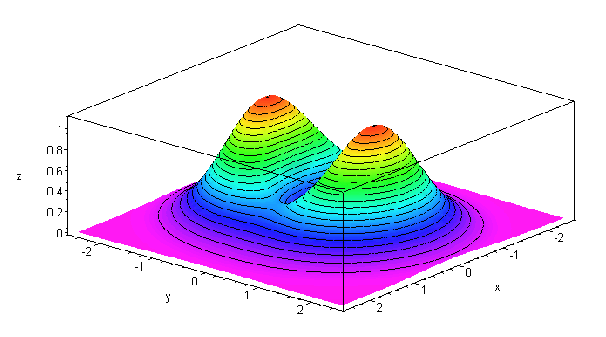
is called a level curve of![]() The relationship between a 3D sketch of
The relationship between a 3D sketch of![]() and the level curves of
and the level curves of![]() is shown below.
is shown below.

Each value of![]() defines a level curve of
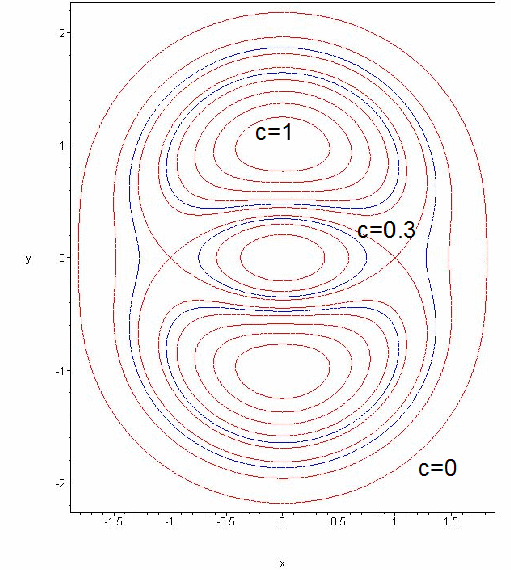
defines a level curve of![]() shown by the black contour lines above. We may reduce the sketch to two dimensions by labelling each contour with the associated
shown by the black contour lines above. We may reduce the sketch to two dimensions by labelling each contour with the associated![]() (or constant).
(or constant).

