Given a straight line plotted on a graph we can estimate the values of the gradient and either using a point on the line or by estimating the y – intercept, we can find the equation of the line in the form![]() The most convenient form in which to analyse the relationship between two variables x and y is the linear form, and we must see if, given a suspected relationship between two variables, we can construct a linear graph from the suspected relationship.
The most convenient form in which to analyse the relationship between two variables x and y is the linear form, and we must see if, given a suspected relationship between two variables, we can construct a linear graph from the suspected relationship.
Suppose we suspect an exponential relationship between two variables. We also have the following data.
|
Time, t ins |
10 |
20 |
30 |
40 |
50 |
|
Mass m in g |
40.3 |
27 |
18 |
12.2 |
8.1 |
Our relationship will take the form![]() To transform this into a straight line we take logs of both sides obtaining,
To transform this into a straight line we take logs of both sides obtaining,![]() We recalculate the table.
We recalculate the table.
|
Time, t ins |
10 |
20 |
30 |
40 |
50 |
|
log (m) |
3.696 |
3.296 |
2.890 |
2.501 |
2.092 |
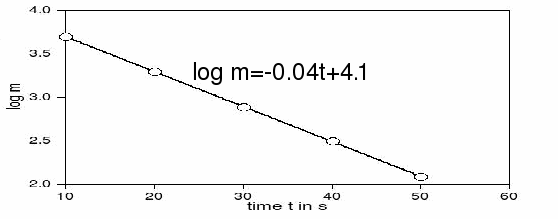
And sketch the graph:

Comparing![]() with
with![]() we see
we see![]() so
so ![]() and
and![]() so
so![]() then
then![]()
