Introduction:
In this experiment you are going to use a data-logger to obtain data on how the resistance of a cell and the current drawn from it affects the terminal voltage and power supplied by the cell. The resistance of the cell is approximately 0.3 ohms. In this experiment you are going to assume that an additional resistance SD is also inside the cell. You will use the data-logger to perform calculations and draw graphs. The graphs will be displayed on the computer monitor. Please follow the instructions below carefully remembering that computers and their software are stupid!
Apparatus:
1.5V cell, Mounted and taped unknown resistor r labelled SD, 0 to 1000¦ resistance box, 6 wires. Data logging equipment used to record current and voltage levels.
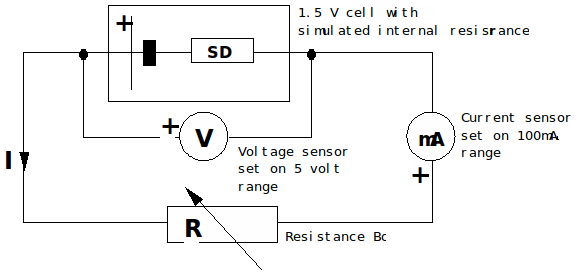
Diagram (of electrical circuit):

Procedure:
Setting up the circuit:
1. The PC has already been switched on and the data logger and sensors have already been wired up to it. DO NOT SWITCH OFF THE PC OR ALTER THE WIRING. Switch on both sensors (Press 'ON' buttons). Set the scales to ±5V & ±100mA. Do not alter these scales during the experiment (ignore any messages such as "CHANGE SCALE".
2. Set up the circuit as above. The 1.5 volt cell has a simulated internal resistance, r (Resistor with 4 mm yellow plugs labelled SD). The voltmeter and ammeters are voltage and current sensors connected to the data-logger.
3. Set the resistance (R) of the resistance box =100¦. The voltmeter should read about 1.5 volts. The ammeter should read about 15 mA.
Setting up the program:
S1. On the PC double click on the DATADISC PRO icon and wait for the program to load. After a few seconds a screen containing menus should appear.
S2. From the MEASURE menu select "RECORD". The Recording Choice Demon screen should appear. Select "Record point(s) when I choose (Space bar recording)"
S3. Click on NEXT. The next screen concerns channels to record from. Make the x-axis = channel 2 current.
Do not alter anything else (the time selection will automatically deselect itself). Click NEXT
S4. For all the other screens click NEXT until the final one where you should click FINISH. Do not alter any of the selections.
S5. A window containing graph axes should now appear. Maximise this window.
Collecting Data:
C1. Prepare a table in your class book headed "Terminal potential difference /V" and "Current / mA". When you are ready, start the data recording process click on the START icon (looks like a tape recorder) below the menu bar.
C2. Adjust the resistance box to 40 ohms. Click on the space bar to record the set of voltage and current readings.
At the same time make a written record of the readings.
Reduce the setting of the resistance box R to 38 ohms and repeat.
Repeat for all even values of R down to and including zero ohms.
C3. Finally click on the FINISH icon (looks like a hand).
A choice box appears. Click on "KEEP THIS DATA".
Manual Graph Work:
M1 In your practical book plot a graph of terminal potential difference against current.
Your points should form a best fit straight line of negative gradient.
Measure the gradient of your graph, it should equal the approximate value of resistance SD.
Estimate the uncertainty in your calculation.
Displaying & analysing data using the computer & printer:
D1. A graph should have appeared on the screen after stage C3 above. It is the computer's version of your hand-drawn graph. Find the approximate value of its gradient. Note: if the printer is working, you may like to print out this graph.
D2 Under the DATA menu choose "calculate". Click button "a x b" which calculates
the power output of the cell in mW. Click CALCULATE
D3 Again under the DATA menu choose "calculate". Click button "a / b" which calculates
the resistance in ohms. Click CALCULATE
D4 Under the GRAPH menu choose "set axis". Set the y-axis to power and the x-axis to resistance, unclick anything else, then click OK.
D5 The screen should now display how the power output of the cell varies with the load resistance. Estimate the resistance when the power output is maximum.
Further Write Up:
W1. Compare and contrast your procedure for finding the resistance SD by drawing a graph manually and by using the computer.
W2. Comment on your answer from stage D5.
[If you need to retake your data you will need to follow the procedure below:
A1. Repeat set up stages, S2 to S5, collecting data stages, C1 to C3 collecting stages only.
A2. After clicking "KEEP THIS DATA" you will be presented with a "data information" screen.
Click "OK" twice and "YES" once to allow previous files to be overwritten. You should eventually be returned to the graph (stage D1 above).]
