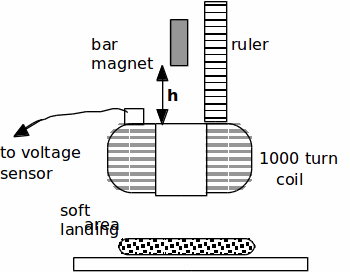
Apparatus:
PC, DL128 data logger with a voltage sensor, 1000 turn coil, leads to connect this coil to the voltage sensor, 2 x clamp, boss etc., 50 cm ruler, bar magnet and soft landing area for this magnet.
Introduction:
In this experiment you are going to use a data-logger to show how the induced voltage in a coil varies with time as a bar magnet falls through its centre. This variation will be shown graphically on the computer monitor. Please follow the instructions below carefully remembering that computers and their software are stupid!
Procedure:
1. The PC has already been switched on and the data logger and sensor have already been wired up to it. DO NOT SWITCH OFF THE PC OR ALTER THE WIRING. Switch on the voltage sensors (Press 'ON' button). Set the scale to ±1V. Try not to alter this scale during the experiment (ignore any messages such as "CHANGE SCALE"). You may have to change it to ±5V if the magnet is very strong.

2. Clamp the 1000 turn coil about 20 cm above the bench. Clamp also the ruler above the coil so that your set up looks like that shown above. The soft landing area should be placed directly below the coil. The bar magnet will be released from a measured height above the coil. It will fall through the coil, inducing a voltage in the coil as it passes.
Setting up the program:
S1. On the PC double click on the Datadisc Pt icon and wait for the program to load. After a few moments a screen containing a menu should appear.
S2. From the MEASURE menu select "Fast". A new window with a graph chart should appear.
S3. From the left hand menu of time choices select "Fast Record" = 400ms.
Collecting Data:
C1. READ ALL OF THIS PARAGRAPH BEFORE DOING ANYTHING!
To collect data you initiate the computer by pressing the green RECORD icon (looks like a tape recorder below the menu bar). Immediately after doing this the magnet should be released. During the subsequent 400 milliseconds the computer collects voltage data from the sensor as displays it on the screen.
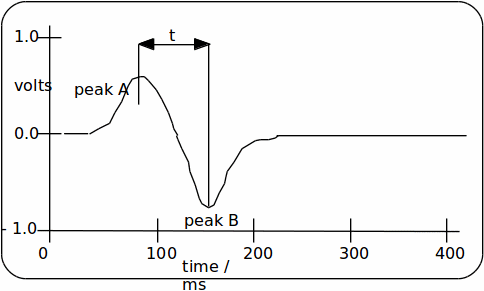
C2. Hold the magnet about 10 cm above the coil, (note the height, h) click RECORD and release the magnet. You should obtain a trace like that shown above on the right. (Do not worry if the peaks are inverted).

C3. From the screen, note the magnitudes (in volts) of peaks A & B and the time interval, t between their maxima.
C4. Hold the magnet at some different height, h (between 0 and 40 cm) and repeat stages C2 & C3. You will now have two lines of different colours on the screen.
C5. After noting the second set of results click the FINISH icon (looks like a hand).
C6. Choose "Discard this data". This will return you again to a blank screen with just the top
initial menu bar.
C7. Repeat stages C2 & C3 and occasionally C5 & C6 and so obtain about ten sets of results.
Note you can have up to eight different lines on the screen at one time.
Write up:
1. Tabulate your results.
2. Graphically investigate the relationship between the height of peak A (or B - you choose) against height of drop, h.
3. Explain the shape of the trace shape above. For example explain why the magnitude of peak B is always greater than that of peak A.
