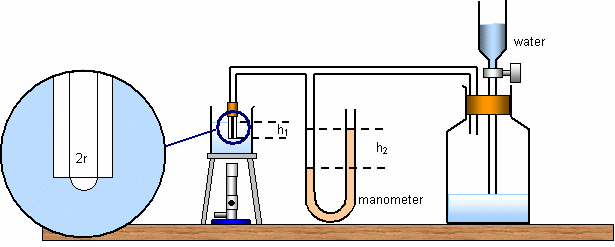
As a fluid is heated it becomes less viscous, and it seems logical that the surface tension will decrease. This is in fact the case in general: it becomes zero at the critical temperature. The apparatus below can be used to investigate the variation of surface tension with temperature.

Water drips into a large flask (right hand side), forcing bubbles of air out of the capillary tube on the left (shown magnified) with lower end submerged to a depth h. The bubble will free itself from the bottom of the capillary tube when the angle it's radius equals the internal radius of the tube (the angle of contact is then 0 degrees).
The pressure exerted by the air inside the apparatus may be using be looking at the manometer. It is ![]() where
where![]() is the atmospheric pressure and
is the atmospheric pressure and![]() is the density of water and this is equal to the pressure exerted by the manometer
is the density of water and this is equal to the pressure exerted by the manometer![]() where
where![]() is the density of the liquid in the manometer. Equating these two gives
is the density of the liquid in the manometer. Equating these two gives![]()
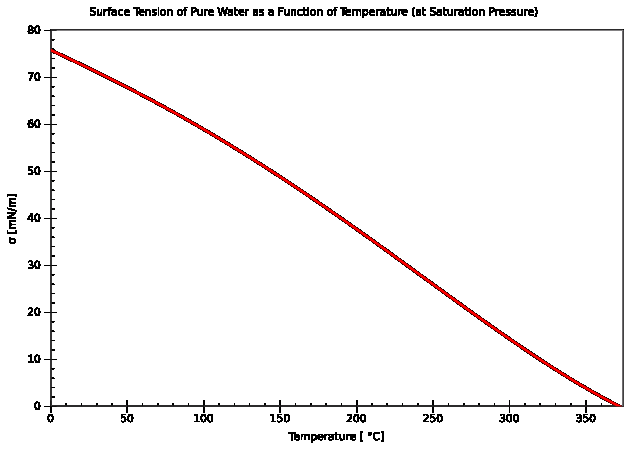
Hence the surface temperature can be found, and repeating the experiment for a range of temperatures enables us to plot a graph of the surface tension of water against temperature. The graph below is obtained.

