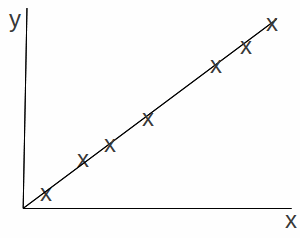
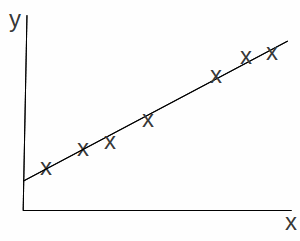
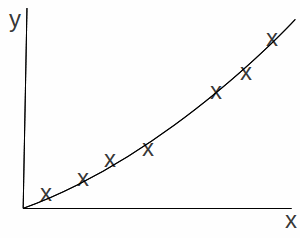
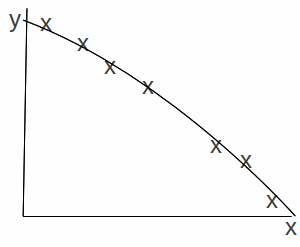
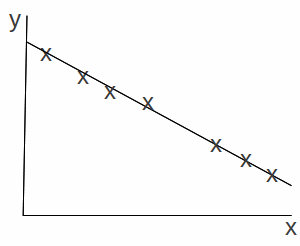
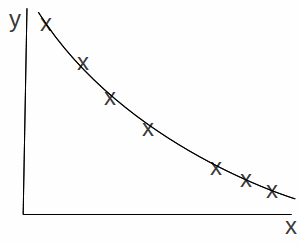
Two quanties may have a range of relationships. Usually the best way to establish a relatioship is to plot a graph of one quantity against the other. Possible relationships between two quantities are shown below.
|
|
|
|
x and y are directly proportional. We can write y=kx where k is a constant of proportionality. |
There is a linear relationship between x and y. We can write y=mx+c |
|
|
|
|
x and y increase together but are not linearly related. |
If x increases y decreases and vice versa. There is no linear relationship between x and y. |
|
|
|
|
There is a negative linear relationship between x and y. We can write y=mx+c where m is negative. |
There is a negative relationship between x and y but the relationship is not linear. If x increases, y decreases and vice versa. |

