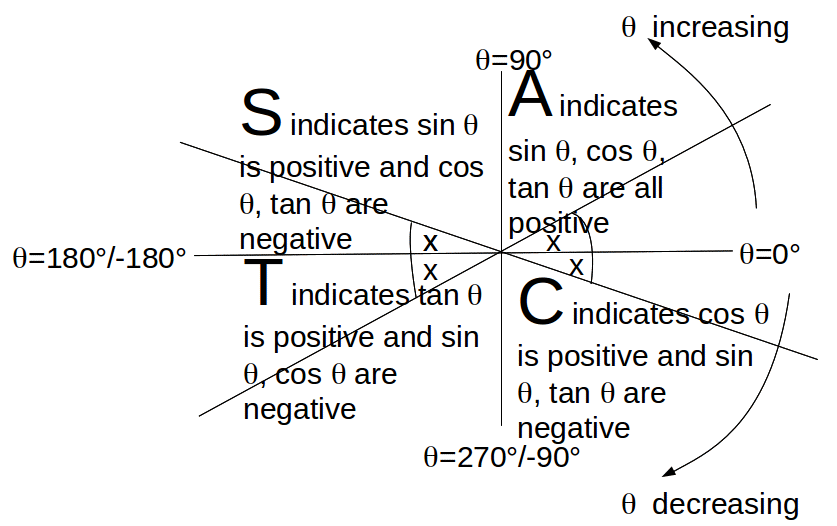
The CASt diagram provides a method to find multiple solutions to trigonometric equations. It indicates the quadrants in which the elementary trigonometric functions are positive (or negative). It is normally shown as below.

The significance of each eletter is shown in the diagram below.

Example: To solve![]() in the range 0° – 360°, find
in the range 0° – 360°, find![]() Since
Since![]() there is another solution in the second (upper left) quadrant. From the diagram above,
there is another solution in the second (upper left) quadrant. From the diagram above,![]() and the second solution is
and the second solution is![]()
Example: To solve![]() in the range -180° – 180°, find
in the range -180° – 180°, find![]() Since
Since![]() there is another solution in the third (lower left) quadrant. From the diagram above,
there is another solution in the third (lower left) quadrant. From the diagram above,![]() and the second solution is
and the second solution is![]()
