Venn diagrams are a means to display categories of data graphically. They are more flexible than contingency tables, allowing complex reasoning, and have many applications in set theory.
Typically each set is illustrated by a bubble, allowing intersection, with one or more of the other sets, and an intersection simultaneously of all the sets. All the regions are a Venn diagram are mutually exclusive and exhaustive, since each element may only appear once on a Venn diagram. This does not mean that the sets are mutually exclusive since, for example, on a Venn diagram illustrating which newspapers people read, with each set representing a different newspaper, a person may read more than one newspaper, hence be in more than one set.
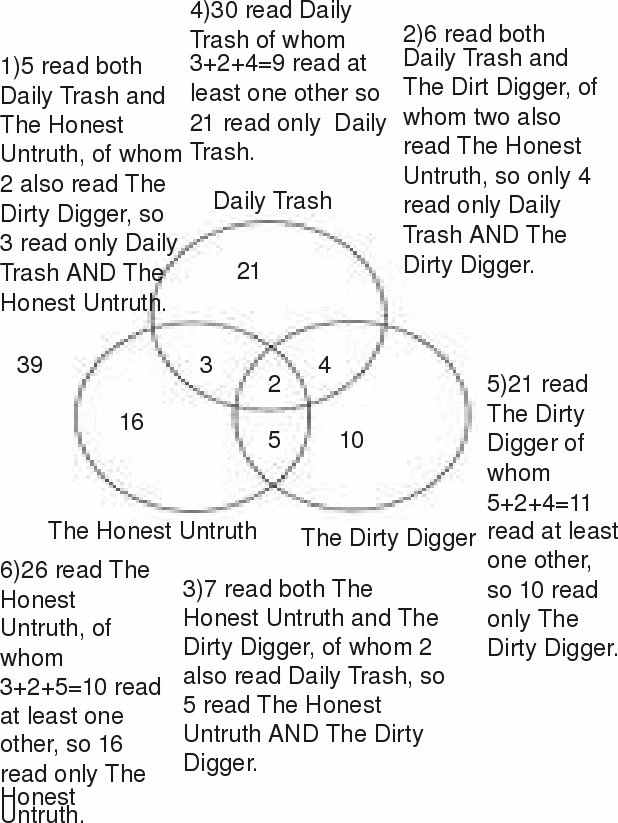
Example: 100 people were asked which newspapers they read. The results showed that 30 read Daily Trash, 26 read The Honest Untruth, 21 read The Dirty Digger, 5 read both Daily Trash and The Honest Untruth, 7 read both The Honest Untruth and The Dirty Digger, 6 read both The Dirty Digger and Daily Trash and 2 read all three.

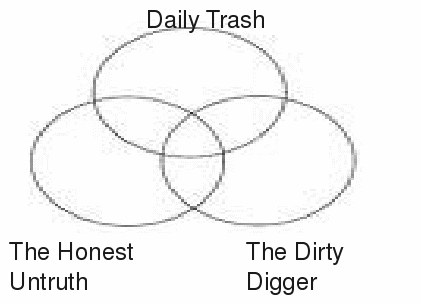
We have to fill out the diagram above. It is best to work out from the centre. 2 people read all three newspapers, so the entry in the central region is 2. Complete the regions in the order shown:1) 2) 3) 4) 5) 6). At the end, of the 100 people asked, 61 read a newspaper an 39 don't. This number, 39, goes outside any set as shown.

