The diagram illustrate a scaling in the x – direction. If the x -values increase by a factor of 3, then we can represent the transformation by the matrix
![]() If the corners of the rectangle are at
If the corners of the rectangle are at![]() and
and![]() then the new vertices will be at
then the new vertices will be at
![]() respectively.
respectively.
The scale factor in the x – direction is 3 and there is no scaling in the y – direction so the new area is 3 times the old one.
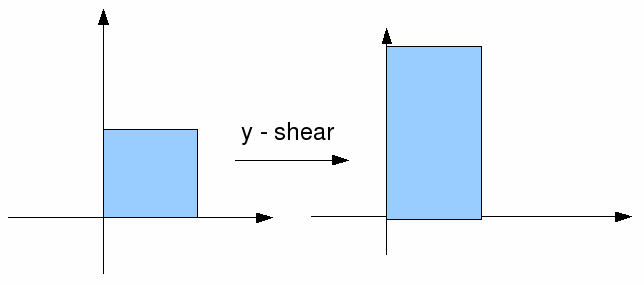
A scaling in the y direction is illustrated below.

If the y – values increase by a factor of 5, then we can represent the transformation by the matrix![]()
If the corners of the rectangle are at![]() and
and![]() then the new vertices will be at
then the new vertices will be at
![]() respectively.
respectively.
The scale factor in the y – direction is 5 and there is no scaling in the x – direction so the new area is 5 times the old one.
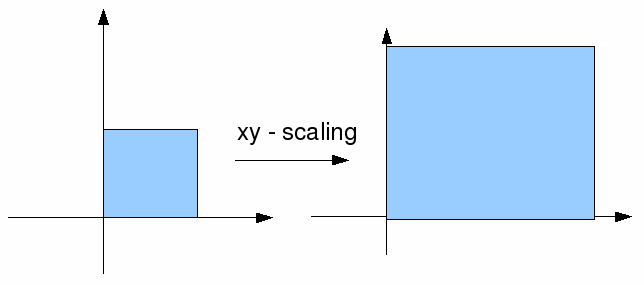
We can combine scalings in the x – direction with scalings in the y direction, and represent them both in a single matrix. A scaling in the x direction by 3 combined with a scaling in the y direction by 5 can be represented by the matrix![]() This is illustrated below.
This is illustrated below.

If the corners of the rectangle are at![]() and
and![]() then the new vertices will be at
then the new vertices will be at
![]() respectively.
respectively.
Ths scale factor in the x – direction is 3 and the scale factor in the y – direction is 5 so the new area is 3*5=15 times the area of the old one.
