Every experiment or scientific observation involves making and recording measurements. Taking measurements is not an activity that can be carried out with absolute precision, since every ruler can only record to the nearest millimetre and every stopwatch can only record to the nearest 0.01 seconds for example, even if the person making the measurements is alert and meticulous. The procedure for treating data is shown below for air pollution due to![]()
|
What You Should Do |
Data |
Description |
|
Take several measurements. Not all measurements will be the same. |
Concentration of Note that 19.0 is correct to one decimal place, so the true value is between 18.95 and 19.05 |
The measurements are called the data set. |
|
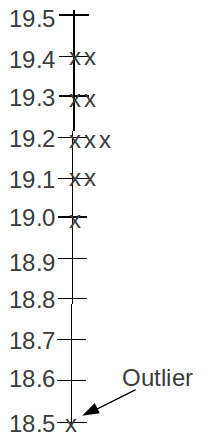
Plot the results on a graph. Any point very different from the others is called an outlier and should be discarded. |
|
The reading of 18.5 is an outlier. |
|
The outlier is probably a mistake and should be ignored. |
The average is |
The average is also called the 'mean'. |
|
The mean is a more accurate measurement of air pollution than any of the nine measurements. |
The best estimate for air pollution due to |
The mean is used as the measure of |
|
When recording the mean value it is a good idea to record the minimum and maximum readings (excluding outliers). |
The minimum and maximum are 19.0 and 19.4 respectively. |
The interval 19.0 – 19.4 is called the range of the measurements. |

