When drawing a line of best fit it to a set of data points![]() is important to realise that the line should
is important to realise that the line should
1. Pass through the centre of the points![]() where
where![]() is the mean of the x values and
is the mean of the x values and![]() is the mean of the y values.
is the mean of the y values.
2. Should have as many points – or as close as possible - above the line of best fit as below, with as far as possible no cluster of points above or below.
3. Should not necessarily pass through the origin.
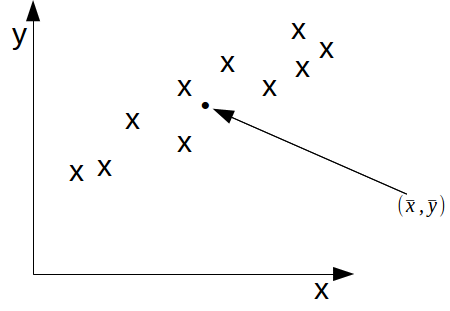
A set of data points and the mean of the data points![]() is shown below.
is shown below.

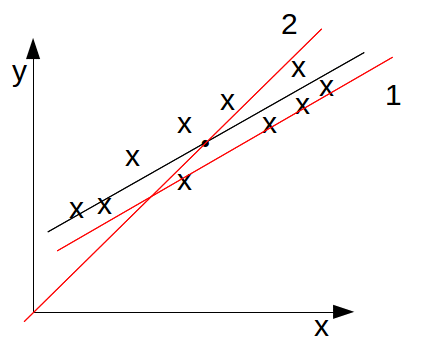
A line of best fit is shown in black below. The lines drawn in red are not lines of best firt.

Line 1 does not pass through the centre of the points and has all but one point lie on or above the line, and line 2 is above most points on the right and below most points on the left in an attempt to make it pass through the origin.
