Sketching Phase Curve Diagrams

Suppose we have the system of coupled differential equations
\[\dot{x}=x+2y\]

\[\dot{y}=y\]

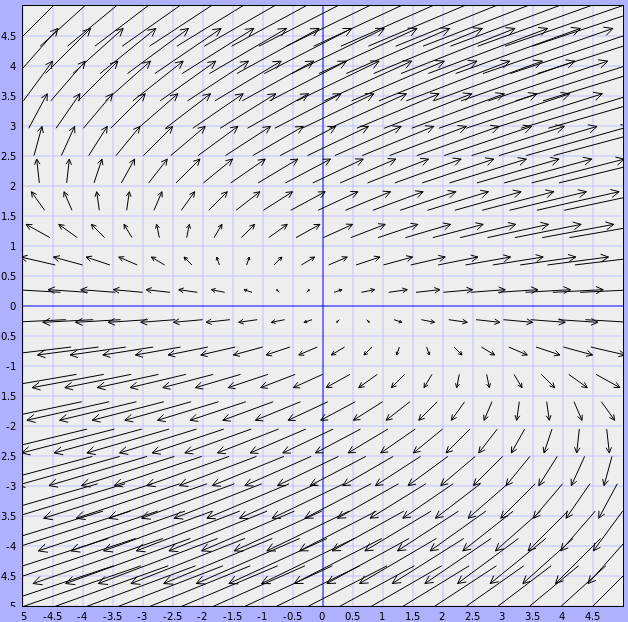
Phase space diagrams illustrate the direction of the velocity field, in this example  
\[\begin{pmatrix}\dot{x}\\ \dot{y}\end{pmatrix}=\begin{pmatrix}x+2y\\y\end{pmatrix}\]
.
At each point  
\[(x,y)\]
  draw the vector  
\[\begin{pmatrix}x+2y\\y\end{pmatrix}\]
.

We can sketch curves - phase curves - to illustrate the velocity profile of the system by drawing smooth curves in the direction of the arrows at each point.

Add comment

Security code
Refresh