Taking the absolute value of a number is equivalent to ignoring any minus sign, We are only interested in the magnitude of a number. For example,
![]() and
and ![]()
We sometimes have to sketch graphs of the form![]()
The graph of![]() is a straight line. When
is a straight line. When![]() ,
, ![]() . If
. If![]() , for example if
, for example if![]() , then
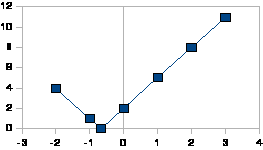
, then![]() which is greater than zero. We can plot the point
which is greater than zero. We can plot the point![]() .
.
If![]() then
then ![]() . This is less than zero. We are plotting the values of
. This is less than zero. We are plotting the values of![]() against absolute values of y, so we find the absolute value of
against absolute values of y, so we find the absolute value of![]() which is 1 and plot the point,
which is 1 and plot the point,![]() . At the point where
. At the point where![]() is zero, on one side of which it would be negative, and on the other side positive, if were were plotting a line and not an absolute value graph, there will be a “corner”.
is zero, on one side of which it would be negative, and on the other side positive, if were were plotting a line and not an absolute value graph, there will be a “corner”.
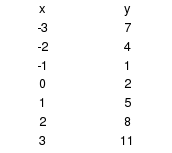
We can draw up the set of values of x and y. They are given below next to the graph.


In general to sketch any graph of this sort we can start by finding the zero: there will be a corner at that point. On either side of the corner will be a straight line. It is then enough to find one point either side of the corner to draw the graph.
Finding the corner can sometimes be tricky, but you ownly have to find where the modulus part is zero.
For the graph![]() the corner is when
the corner is when![]() at the point
at the point![]()
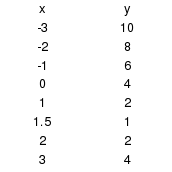
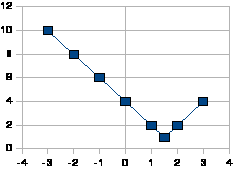
For the graph![]() the corner is when
the corner is when![]() , at the point
, at the point![]() , shown below.
, shown below.


