Relationships between quantities or objects occur in various ways.
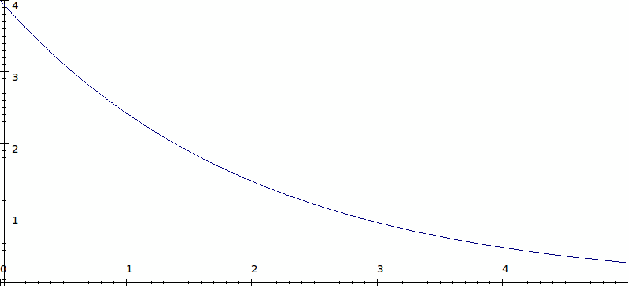
A very familiar example is where an equation exists to express one quantity in terms of the other. We can find a set of points satisfying the equation and display the relationship on a graph. For instance, the amount of radioactive material A in a sample can be expressed in terms of time t:![]() where
where![]() is a positive constant and
is a positive constant and![]() is the amount of radioactive material present initially. This is illustrated below.
is the amount of radioactive material present initially. This is illustrated below.

This second form represents relationships that are found in discrete mathematics. In discrete mathematics the set of elements is countable and has a one-to-one correspondence with either the set of positive integers, or a subset of the positive integers.
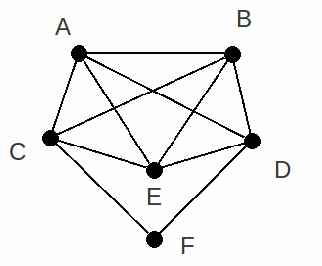
Another type of graph is useful for illustrating relationships between objects. In the diagram below the vertices, labelled with letters, could be towns, and the lines between them could be roads. We could label the lines with numbers to show distances between the different towns.

Or the vertices could represent people and two people could be connected by a line if they are acquainted, for example. Representing Objects and relationships in this way allows a wide range of problems to be solved.
