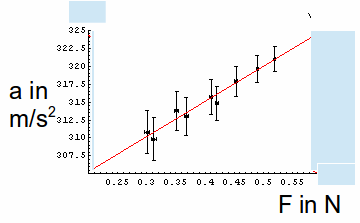
To demonstrate the method, suppose I plot a graph of force F against acceleration. Uncertainty in measuring the acceleration result in the graph below.


The line of best fit goes through the centres of the error bars. The gradient of the line will be the reciprocal of the mass. Because of the error bars however there will be uncertainty in the mass.
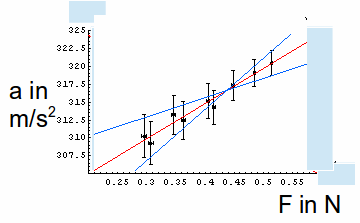
To find the maximum and minimum possible values of the mass find the maximum and minimum possible values of the gradient. Draw two extra lines with the maximum and minimum gradients possible that still fit within most error bars.
The maximum gradient is![]() and the minimum gradient is
and the minimum gradient is![]()
