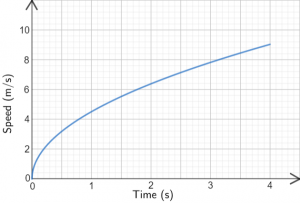
\[\frac{1}{2}(0+4.4) \times 1=2.2m\]
.In the second second the distance travelled is approximately
\[\frac{1}{2}(4.4+6.4) \times 1=5.4m\]
.In the third second the distance travelled is approximately
\[\frac{1}{2}(6.4+7.8) \times 1=7.1m\]
.In the fourth second the distance travelled is approximately
\[\frac{1}{2}(7.8+9.0) \times 1=8.4m\]
.The total distance travelled is
\[2.2+5.4+7.1+8.4=23.7m\]
.The average speed is approximately
\[\frac{23.7}{4}=5.9 m/s\]
. 