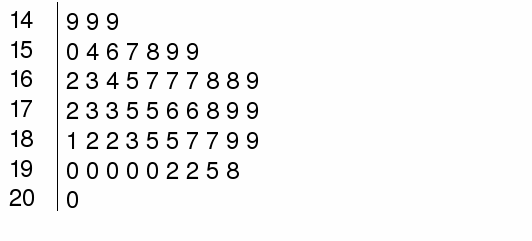
A stem and leaf diagram is a compact way to display a list is a way that enables the shape of the list to be quickly perceived.
For example we start with a list of numbers that represent the heights of 50 adults men:
190, 149, 150, 172, 183, 190, 178, 189, 179, 176, 164, 165, 192, 167, 182, 169, 168, 173, 200, 176, 156, 159, 167, 162, 198, 181, 168, 185, 173, 192, 195, 175, 190, 187, 190, 175, 154, 159, 163, 179, 182, 149, 158, 185, 190, 189, 149, 157, 167, 187
We first sort them into numerical order:
149, 149, 149, 150, 154, 156, 157, 158, 159, 159, 162, 163, 164, 165, 167, 167, 167, 168, 168, 169, 172, 173, 173, 175, 175, 176, 176, 178, 179, 179, 181, 182, 182, 183, 185, 185, 187, 187, 189, 189, 190, 190, 190, 190, 190, 192, 192, 195, 198, 200
The data are all between 140 and 210 so we could have intervals of 10 starting at 140:

We the draw a vertical line to separate the interval from the actual values. We can now fill in the values on the right hand side:

Two Sided Stem And Leaf Diagrams
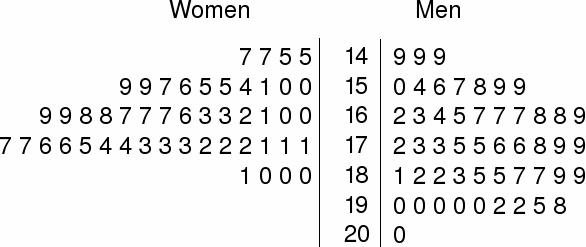
We could compare the heights of men and women in many ways. One of the simplest is to draw a two sided stem and leaf diagram. Suppose for simplicity we have the heights of 50 women already sorted into numerical order:
145, 145, 147, 147, 150, 150, 151, 154, 155, 155, 156, 157, 158, 158, 160, 160, 161, 162, 162, 163, 163, 166, 167, 167, 167, 168, 168, 169, 169, 170, 170, 170, 171, 171, 171, 171, 172, 172, 172, 173, 173, 173, 173, 174, 174, 175, 176, 176, 177, 177
We can see from the diagram below that men are typically taller than women.

