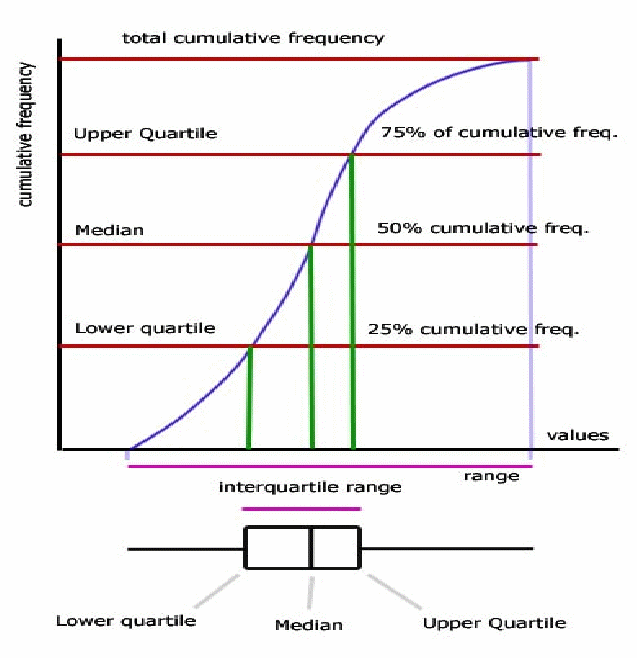
The relationship best illustrated by using the same x axis for boxplot and curve. Minimum, lower quartile, median, upper quartiles and maximum clearly correspond.


The relationship best illustrated by using the same x axis for boxplot and curve. Minimum, lower quartile, median, upper quartiles and maximum clearly correspond.