The general equation of a line is![]() where
where![]() and
and![]() are the variables that label the axes and m and c are constants.
are the variables that label the axes and m and c are constants.
-
 is called the independent variable. It is the variable that can be controlled in an experiment.
 -
 is called the dependent variable. It changes in response to a change in
-
 is the gradient, equal to a change in
 along the graph divided by a change in
-
 is the
 intercept – the point on the
 axis where the line crosses.
Often a direct plot of the variables will produce a straight line. If so then we can find the gradient and![]() – intercept from the graph and use the resulting equation to find any value of
– intercept from the graph and use the resulting equation to find any value of![]() given a value of
given a value of![]() and vice versa.
and vice versa.

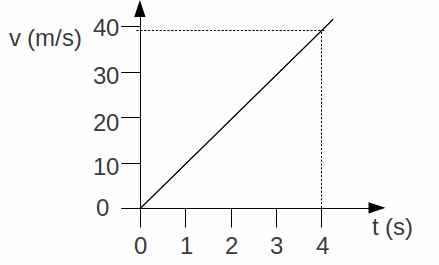
The gradient of the graph above is approximately![]()
