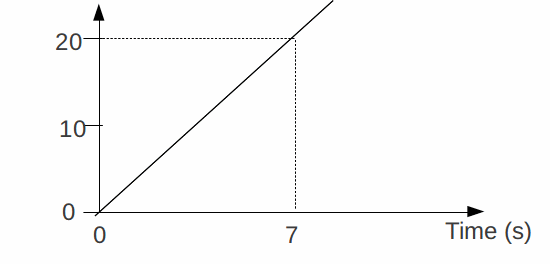
Acceleration time graphs indicate the acceleration relative to particular point as a vector. One direction is taken as positive and one direction is taken as negative, so only these this forwards and backwards motion can be displayed. At any time t the acceleration can be read off the vertical axis by moving up from a certain time t to meet the graph then along to read off the acceleration. For example the acceleration at t=7 s below is 20 m/s/s or![]()

General Points
-
The gradient at any point is equal to the rate of change of acceleration, not a very meaningful quantity. In particular a horizontal line has zero acceleration or constant velocity.
-
At any time when the graph intercepts the t axis, the acceleration AT THAT INSTANT is zero.
-
The area under an acceleration time graph is equal to the velocity. For the example above, the velocity after 7 s is

-
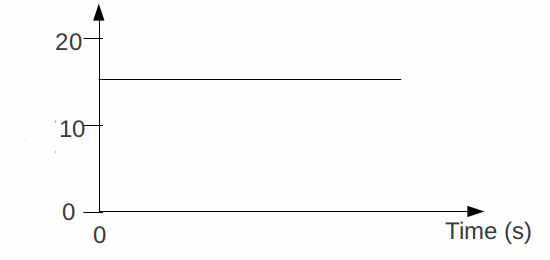
If the acceleration is constant the graph of acceleration against time is a horizontal line with the y – value equal to the acceleration. The acceleration illustrated in the graph below is


