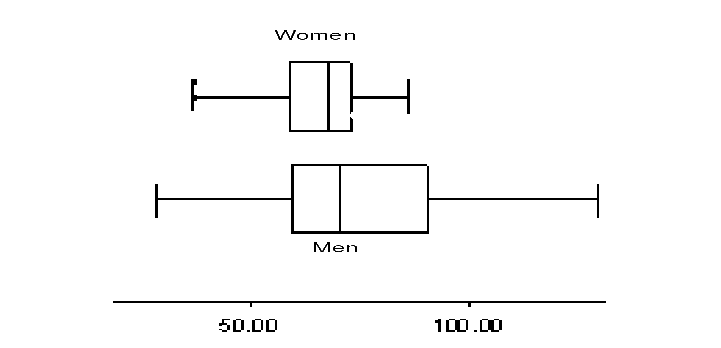
A five figure summary is a set of five numbers that summarises a list of data. It constants of the smallest value, the lower quartile, the median, upper quartile and largest value. A boxplot us a simple diagram to illustrate this visually.

Boxplots make comparison between two groups easy. We can draw boxplots for each on the same diagram. We can use the diagram to see and analyse any differences. The diagram below shows boxplots for weights of men and women. Men are typically heavier but their weights have more variability. Women are all just average.