If![]() is a real function then an iteration sequence of the form
is a real function then an iteration sequence of the form![]() can be represented graphically using the graphs
can be represented graphically using the graphs![]() and
and![]() plotted on the same axes. Any intersection of the curve
plotted on the same axes. Any intersection of the curve![]() and the line
and the line![]() represents a fixed point of
represents a fixed point of![]()

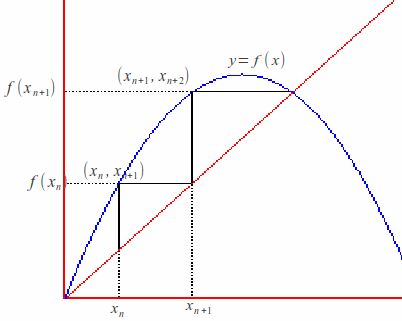
The diagram illustrates the iteration process.
Given the point![]() draw a vertical line to meet
draw a vertical line to meet![]() at
at![]()
Draw a horizontal line to meet![]() at
at![]()
Given any initial point![]() we can apply the above steps repeatedly to construct the sequence
we can apply the above steps repeatedly to construct the sequence![]() The diagram above suggest the sequence converges to the value of
The diagram above suggest the sequence converges to the value of![]() given by the intersection of
given by the intersection of![]() and
and![]()
We can illustrate this for the function![]() There is a fixed point at
There is a fixed point at![]() (there is also a fixed point at
(there is also a fixed point at![]() ) .Start with
) .Start with![]()
![]() Plot
Plot![]() and
and![]()
![]() Plot
Plot![]() and
and![]()
![]() Plot
Plot![]() and
and![]() and so on.
and so on.
