A histogram is drawn as length of weight for example on the horizontal axis against frequency density on the vertical axis. Both axes have a linear scale.
When drawing the bars of histograms there are three simple relationships:
![]()
![]()
![]()
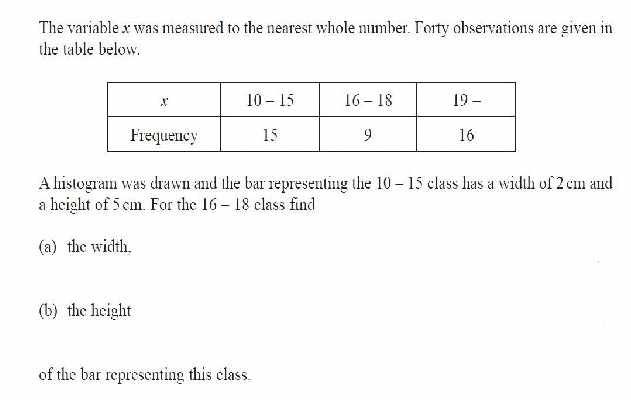
These equations may be used as in the below example:

Notice that the intervals or bin sizes are 9.5 -15.5, 15.5 – 18.5 and 18.5 - {} respectively since else we would have gaps: all the x's are to the nearest whole.
a)![]()
b)![]()
