

Minimise
\[z=30a+40b\]
subject to the constraints\[2a+b \geq 12\]
\[a+b \geq 9\]
\[a+3b \geq 15\]
and of course
\[a, \: b \geq 0\]
:We plot these inequalities - as equalities - on a graph. We seek to maximise the objective function, so draw the line
\[3x+40y=C\]
for various values of \[C\]
, seeking to find the maximum value of \[C\]
for which the objective function is in or on a boundary of the feasible region (the part of the graph that satisfies all the constraints.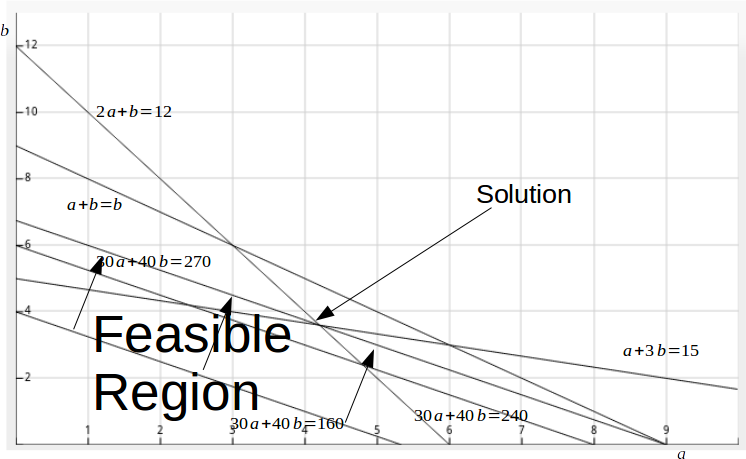
\[2a+b=12\]
and \[a+3b=15\]
.Solving the equations
\[2a+b=12\]
\[a+3b=15\]
gives
\[a=4.2, \: b=3.6\]
The value of the objective is
\[30a+40b=30 \times 4.2+40 \times 3.6=270\]