

A velocity time graph is a graph of time on the x axis plotted against velcity on the y axis.
Velocity time graphs have two very important features:
The area under the graph represents the displacement from the start point.
The gradient of the graph at any point is the acceleration at that point. It the graph slopes up the velocity is positive. If the graph slopes down the velocity is negative.
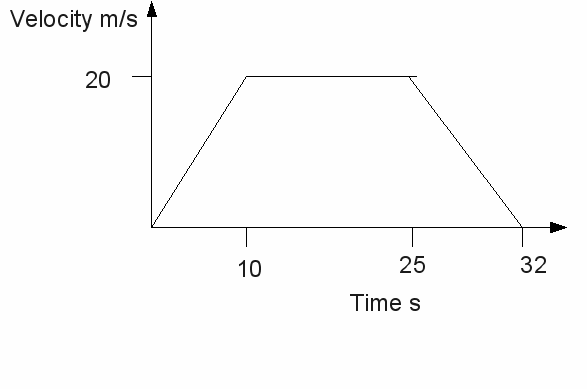
The diagram above shows the motion of a car between two sets of traffic lights.
The initial acceleration is the slope of the graph when![]()
The final acceleration is the slope of the graph between![]()
The area under the graph, hence the distance travelled can be used as a condition.
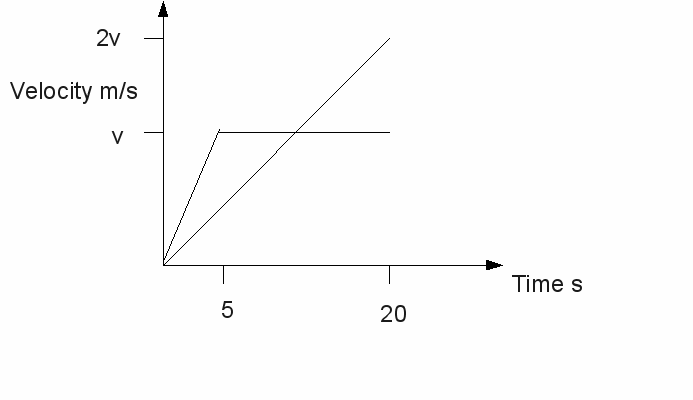
The diagram illustrates the motion of two cars. One car is stationary at traffic lights and when the lights turn green it starts to accelerate, moving with constant acceleration until![]() Another car starts to accelerate at the same time but when
Another car starts to accelerate at the same time but when![]() it changes, to move with constant velocity. At
it changes, to move with constant velocity. At![]() the second car has travelled
the second car has travelled![]() more than the first. Find
more than the first. Find![]()
![]()
![]()