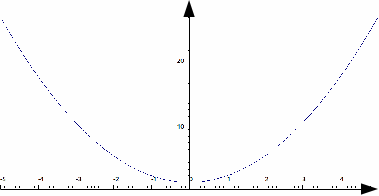
A function is an operation that assigns to each number ![]() in a domain, a unique number
in a domain, a unique number ![]() in a codomain. The function is usually given in the form of an equation,for example,
in a codomain. The function is usually given in the form of an equation,for example, ![]() Each value of
Each value of ![]() gives a unique value of
gives a unique value of ![]() -if this were not so, we would not have a function. To sketch a function we need to find a set of points. This is most easily done by drawing up a table.
-if this were not so, we would not have a function. To sketch a function we need to find a set of points. This is most easily done by drawing up a table.
|
|
-3 |
-2 |
-1 |
0 |
1 |
2 |
3 |
|
|
9 |
4 |
1 |
0 |
1 |
4 |
9 |
|
+1 |
1 |
1 |
1 |
1 |
1 |
1 |
1 |
|
|
10 |
5 |
2 |
1 |
2 |
5 |
10 |

![]()
If we have a graph of a function and we want to know the domain and codomain, then we can find them by looking at the axes. To find the domain, we look at the x-axis. To find the range or codomain we look at the![]() -axis. For the function above, the function is restricted to
-axis. For the function above, the function is restricted to![]() values in the rang [-3,3] so the domain is the interval, [-3,3] and the codomain or range is the interval [1,10].
values in the rang [-3,3] so the domain is the interval, [-3,3] and the codomain or range is the interval [1,10].
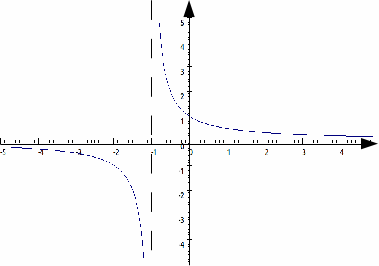
The graph below,![]() has domain
has domain![]() (notice the vertical dotted line, indicating that at
(notice the vertical dotted line, indicating that at![]() so
so![]() can not be equal to -1) and codomain
can not be equal to -1) and codomain![]() If the graph tends toward an
If the graph tends toward an![]() or
or![]() value without reaching it, then that value cannot be in the domain or codomain respectively.
value without reaching it, then that value cannot be in the domain or codomain respectively.

